I-V Curve in Solar PV
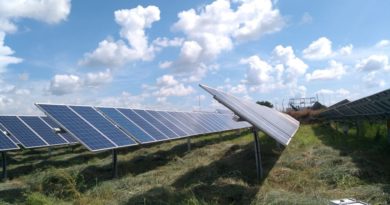
Solar Energy or PV technologies, which harness the sun’s energy to generate electrical power, are one of the fastest growing sources of renewable energy in the market today. Around the world, engineers and scientists are collaborating to lower the material costs of PV cells, increase their energy conversion efficiency, and create innovative and efficient new products and applications based on photovoltaic (PV) technology.
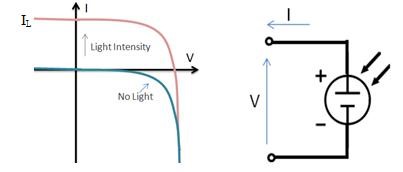
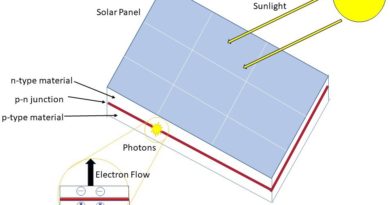
The amount of current generated by photon excitation in a PV cell at a given temperature is affected by incident light in two ways:
- By the intensity of the incident light.
- By the wavelength of the incident rays.
Increasing light intensity will proportionally increase the rate of photo-electron emission in the photovoltaic material. In actual applications, the light absorbed by a PV cell will be a combination of direct solar radiation, as well as diffuse light bounced off of surrounding surfaces. PV cells are usually coated with anti-reflective material so that they absorb the maximum amount of radiation possible.
Understanding of the I-V curve characterization is an utmost important aspect in this connection. As a scope of this article, the basics of IV curve formation and associated terms have been tried to explain.
PV cells can be modeled as a current source. As the intensity of incident light increases, current is generated by the PV cell, as illustrated in Figure 1.
The I-V curve of an illuminated PV cell has the shape shown as below:
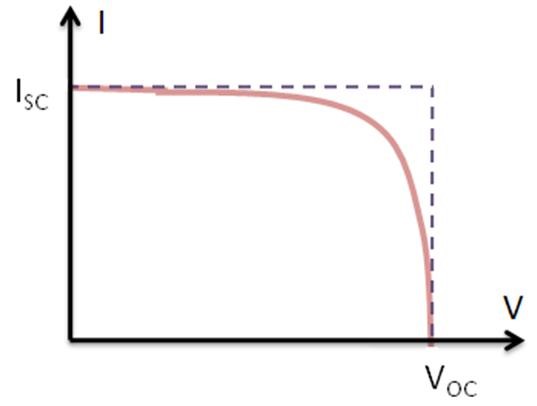
Short Circuit Current (ISC)
The short circuit current ISC corresponds to the short circuit condition when the impedance is low and is calculated when the voltage equals 0.
I (at V=0) = ISC
Open Circuit Voltage (VOC)
The open circuit voltage (VOC) occurs when there is no current passing through the cell.
V (at I=0) = VOC
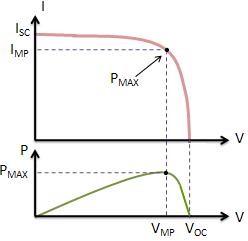
Maximum Power (PMAX), Current at PMAX (IMP), Voltage at PMAX (VMP)
The power produced by the PV cell in Watts can be easily calculated along the I-V curve by the equation P=IV. At the ISC and VOC points, the power will be zero and the maximum value for power will occur between the two. The voltage and current at this maximum power point are denoted as VMP and IMP respectively.
Fill Factor (FF)
The Fill Factor (FF) is essentially a measure of quality of the PV cell. It is calculated by comparing the maximum power to the theoretical power (PT) that would be output at both the open circuit voltage and short circuit current together. FF can also be interpreted graphically as the ratio of the rectangular areas depicted in Figure 4.
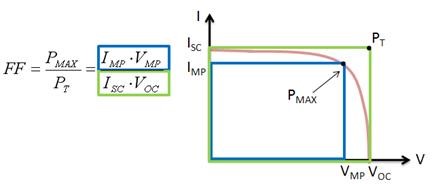
A larger fill factor is desirable and corresponds to an I-V curve that is more square-like. Typical fill factors range from 0.5 to 0.82. Fill factor is also often represented as a percentage.
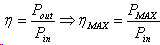
Efficiency (η)
Efficiency is the ratio of the electrical power output Pout, compared to the solar power input, Pin, into the PV cell. Pout can be taken to be PMAX since the PV cell can be operated up to its maximum power output to get the maximum efficiency.
Pin is taken as the product of the irradiance of the incident light, measured in W/m2 or in suns (1000 W/m2), with the surface area of the PV cell [m2]. The maximum efficiency (ηMAX) found from a light test is not only an indication of the performance of the device under test, but, like all of the I-V parameters, can also be affected by ambient conditions such as temperature and the intensity and spectrum of the incident light. For this reason, it is recommended to test and compare PV cells using similar lighting and temperature conditions.
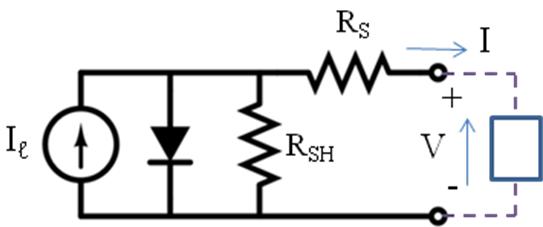
Shunt Resistance (RSH) and Series Resistance (RS)
During operation, the efficiency of PV cells is reduced by the dissipation of power across internal resistances. These parasitic resistances can be demonstrated as a parallel shunt resistance (RSH) and series resistance (RS), as depicted below.
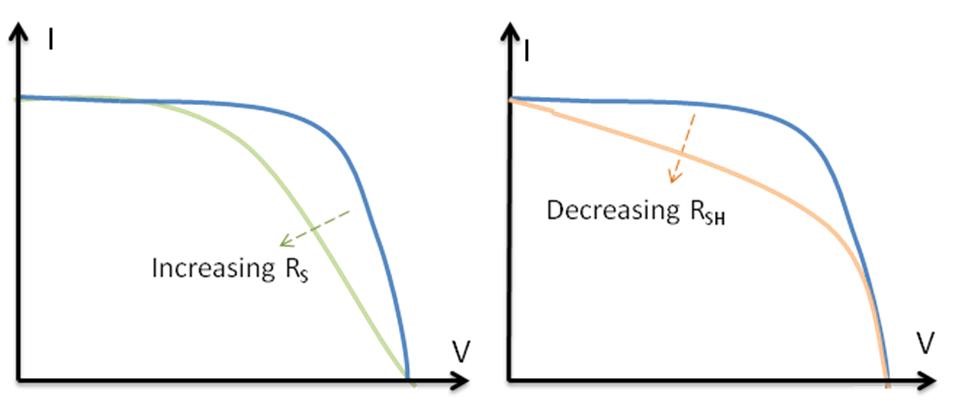
Decreasing RSH and increasing Rs will decrease the fill factor (FF) and PMAX as shown in Figure 6 below. If RSH is decreased too much, VOC will drop, while increasing RS excessively can cause ISC to drop instead.
Temperature Measurement Considerations
The crystals used to make PV cells, like all semiconductors, are sensitive to temperature. The below Figure depicts the effect of temperature on an I-V curve. When a PV cell is exposed to higher temperatures, ISC increases slightly, while VOC decreases more significantly.
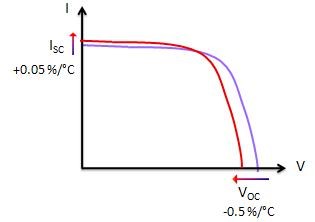
For a specified set of ambient conditions, higher temperatures result in a decrease in the maximum power output PMAX. Since the I-V curve will vary according to temperature, it is beneficial to record the conditions under which the I-V sweep was conducted. Temperature can be measured using sensors such as RTDs, thermistors or thermocouples.
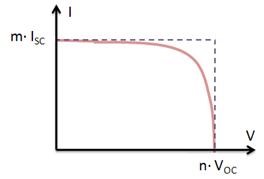
I-V Curves for Modules
For a module or array of PV cells, the shape of the I-V curve does not change. However, it is scaled based on the number of cells connected in series and in parallel. When n is the number of cells connected in series and m is the number of cells connected in parallel and ISC and VOC are values for individual cells, the below I-V curve is produced.
References:
Pingback: Solar PV Plants O&M – A Separate Line of Business - SolarPost